
Hands-on: Planning your work
Goal
Draw the workflow to combine 4 datasets about stream flow and water chemistry in a way that will let you investigate the impact of the 1989 Hurricane Hugo on Stream Chemistry in the Luquillo Mountains of Puerto Rico
A few things to know:
- Table structures are different => only some variables / columns overlap among the different sites
- Units used among the various sites are different
- Period covered is not perfectly aligned for all the time-series. Some sites start or end before others, but there is a period of overlap
Study sites
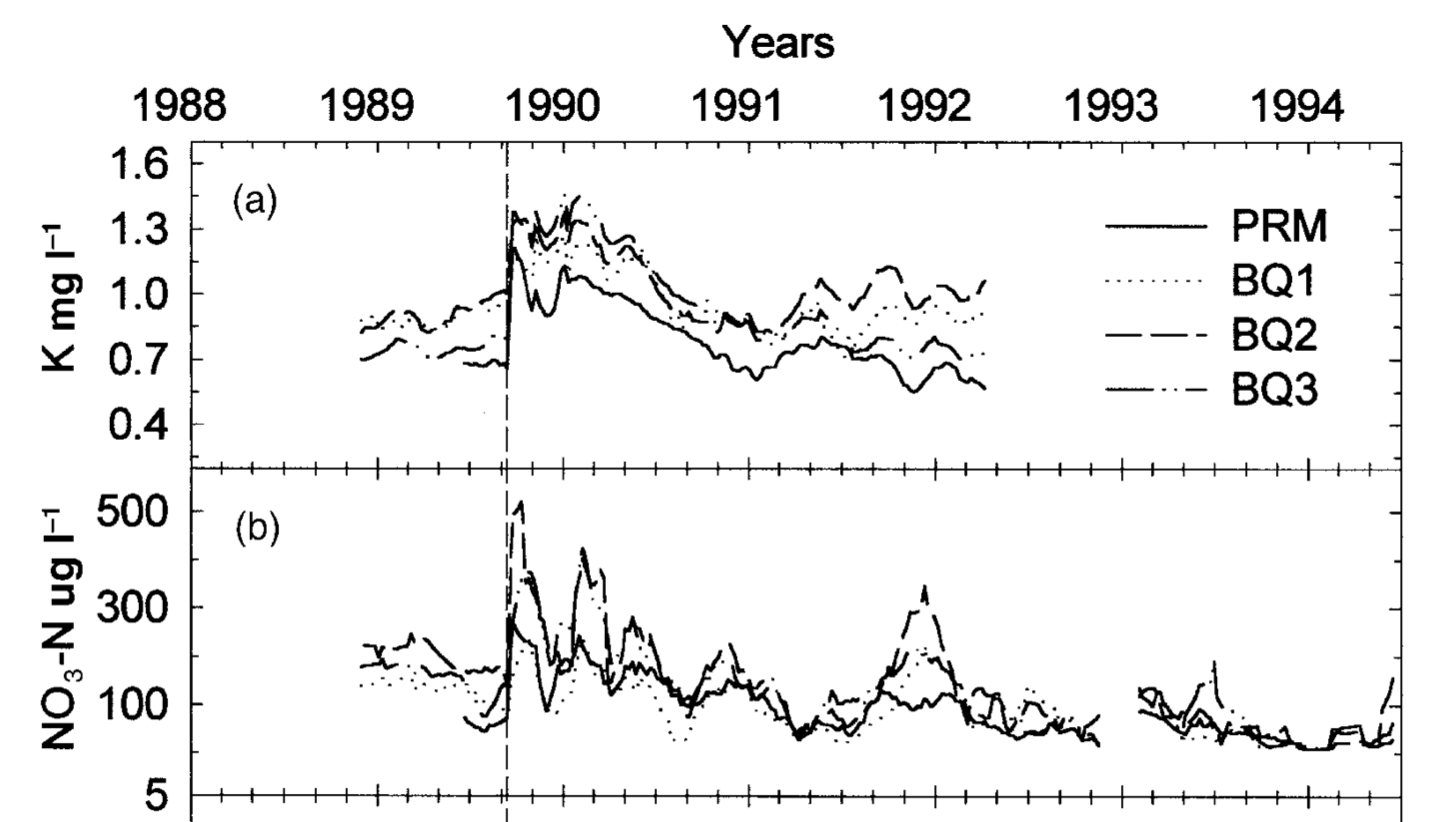
Output
We want to be able to produce this plot
To Do:
Draw the data processing steps to harmonize those data into one dataset that will let you compare time-series data and reproduce the above plot (20min)
I recommend you use the white boards or paper. You can also use https://excalidraw.com/ (but do not take too much time to learn its features! Focus on developing the workflow)
Remember
- Each node represents a
stepor aninput/output - Each connecting edge represents data flow or processing
Oh wait…
References
Exercise based on: Schaefer, D., McDowell, W., Scatena, F., & Asbury, C. (2000). Effects of hurricane disturbance on stream water concentrations and fluxes in eight tropical forest watersheds of the Luquillo Experimental Forest, Puerto Rico. Journal of Tropical Ecology, 16(2), 189-207. doi:10.1017/S0266467400001358
Data available here: McDowell, W. 2021. Chemistry of stream water from the Luquillo Mountains ver 4923052. Environmental Data Initiative. https://doi.org/10.6073/pasta/ddb4d61aea2fb18b77540e9b0c424684 (Accessed 2021-08-06).