Group Project
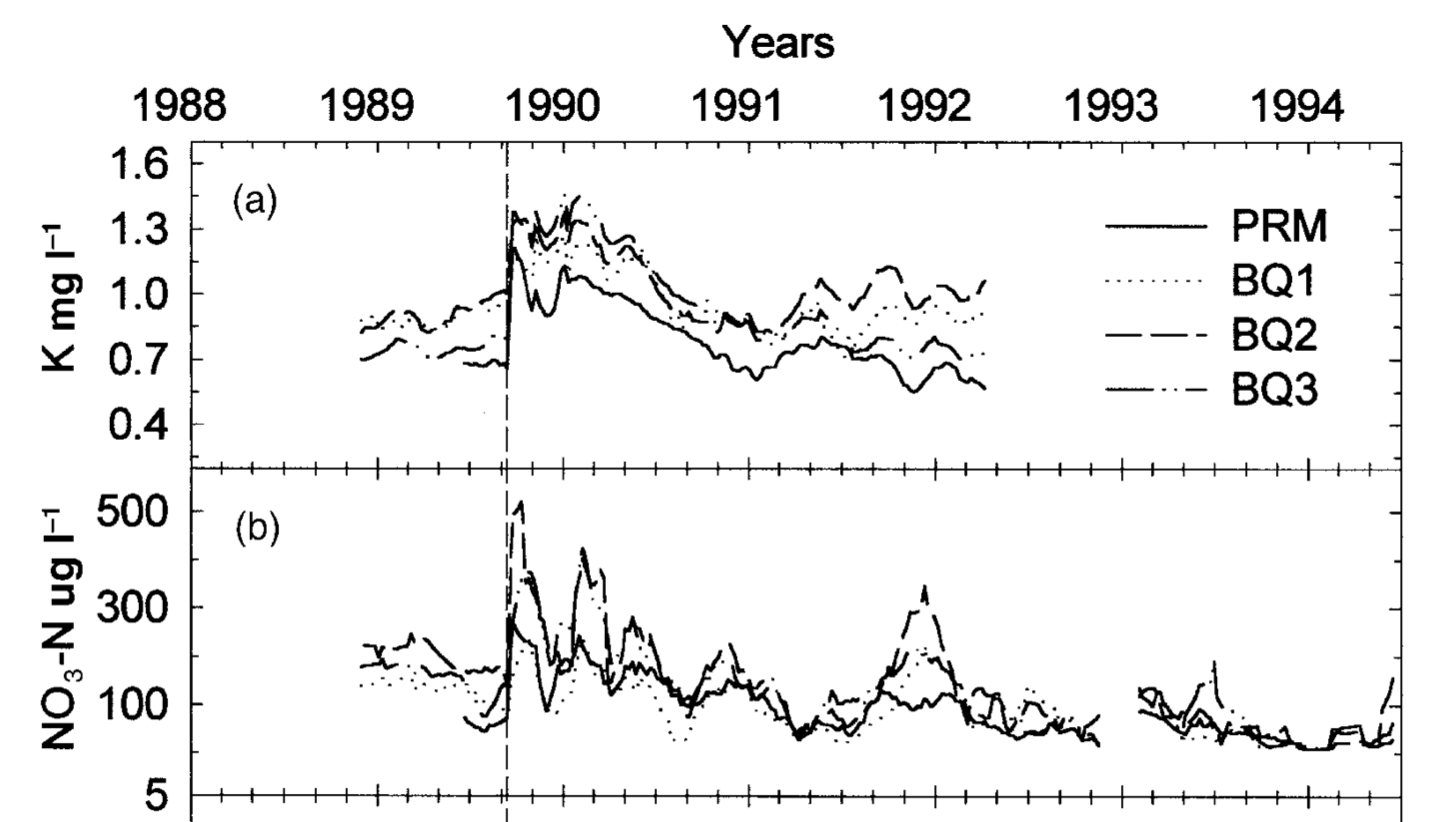
Investigating the impact of Hurricane Hugo on Stream Chemistry data in Luquillo
We are going to build on the exercise we used the first day and work on implementing and refining the workflow we developed during that session.
Here are the expectations
By group of 4-5 collaborators:
- Find an awesome name for your group (one of the hardest steps)
- Setup a shared GitHub repository
- Use the MEDS server
Workbench-1as your main computing resource - Use GitHub to manage your code development in a collaborative manner
- Use shared folder on
Workbench-1to manage your data/courses/EDS214/group_project/my_group_name - Document your work as you go!!
- Comment your code
- Add project details to your README, including reference to data sources
- Use GitHub issues to track your work and discuss progress and tasks
Log your resources on this Google Sheet
Background
The Luquillo Experimental Forest (LEF) has been a center of tropical forestry research for nearly a century. In addition, the LEF is a recreation site for over a half a million people per year, a water supply for approximately 20% of Puerto Rico’s population, a regional center for electronic communication, and a refuge of Caribbean biodiversity. It is the goal of the USDA Forest Service and the University of Puerto to promote and maintain the forest’s role as a center of active and dynamic scientific inquiry. However, to maintain the ecological integrity of the forest while balancing the many demands placed upon it’s resources, certain protocol is required. This guide provides the major protocols that govern research in the LEF. These protocols are designed to help researchers protect the forests, obey the law, create an amiable and non-discriminatory work environment, and provide a historical record for future scientists
Here for more information about the Luquillo site: https://lternet.edu/site/luquillo-lter/
Goals
- Can you recreate that plot (content, not style wise… you can do way better 🙂)
Write a quarto document(s) that: - reads the data in (from a local copy on Workbench-1) - processes the data as needed to be plotted - use ggplot to create a similar (but better looking) plot - comment your code and use markdown text between the code chunks to provide context to your code - render your report as html
- Ask your own question! You are encouraged to define you own question around this topic as a team
Go wild!! Ask your own scientific question using the stream chemistry data but also any other external source of data (like historical hurricane tracks from NOAA). The focus in this part of the project is on the process of how you will be answering the question (planning, workflow, code, data, ….), not on the results per se
Data
Data are available from the Environmental Data Initiative (EDI) that is hosting most of the data of the Long Term Ecological Research (LTER) Network.
Chemistry of stream water data from the Luquillo Mountains
McDowell, W. and International Institute of Tropical Forestry(IITF), USDA Forest Service. 2022. Chemistry of stream water from the Luquillo Mountains ver 4923061. Environmental Data Initiative. https://doi.org/10.6073/pasta/570231c2807a6396ced6a89ef7547bd4 (Accessed 2023-08-24).
Group project presentation (10min; 5 slides)
Major points to hit:
- Goal/Question + workflow you used to achieve it (aka THE plan)
- How did you set up your project (server, data, code, …)
- How did you organize your team (tasks, who did what)
- Results
- Main challenges
Reference
Schaefer, D., McDowell, W., Scatena, F., & Asbury, C. (2000). Effects of hurricane disturbance on stream water concentrations and fluxes in eight tropical forest watersheds of the Luquillo Experimental Forest, Puerto Rico. Journal of Tropical Ecology, 16(2), 189-207. doi:10.1017/S0266467400001358