Flow charts and pseudocode
Planing things
Don’t start implementing nor coding without planning! It is important to stress that scientists write scripts to help them to investigate scientific question(s). Therefore scripting should not drive our analysis and thinking. We strongly recommend you take the time to plan ahead all the steps you need to conduct your analysis. Developing such a scientific workflow will help you to narrow down the tasks that are needed to move forward your analysis.

Flow charts
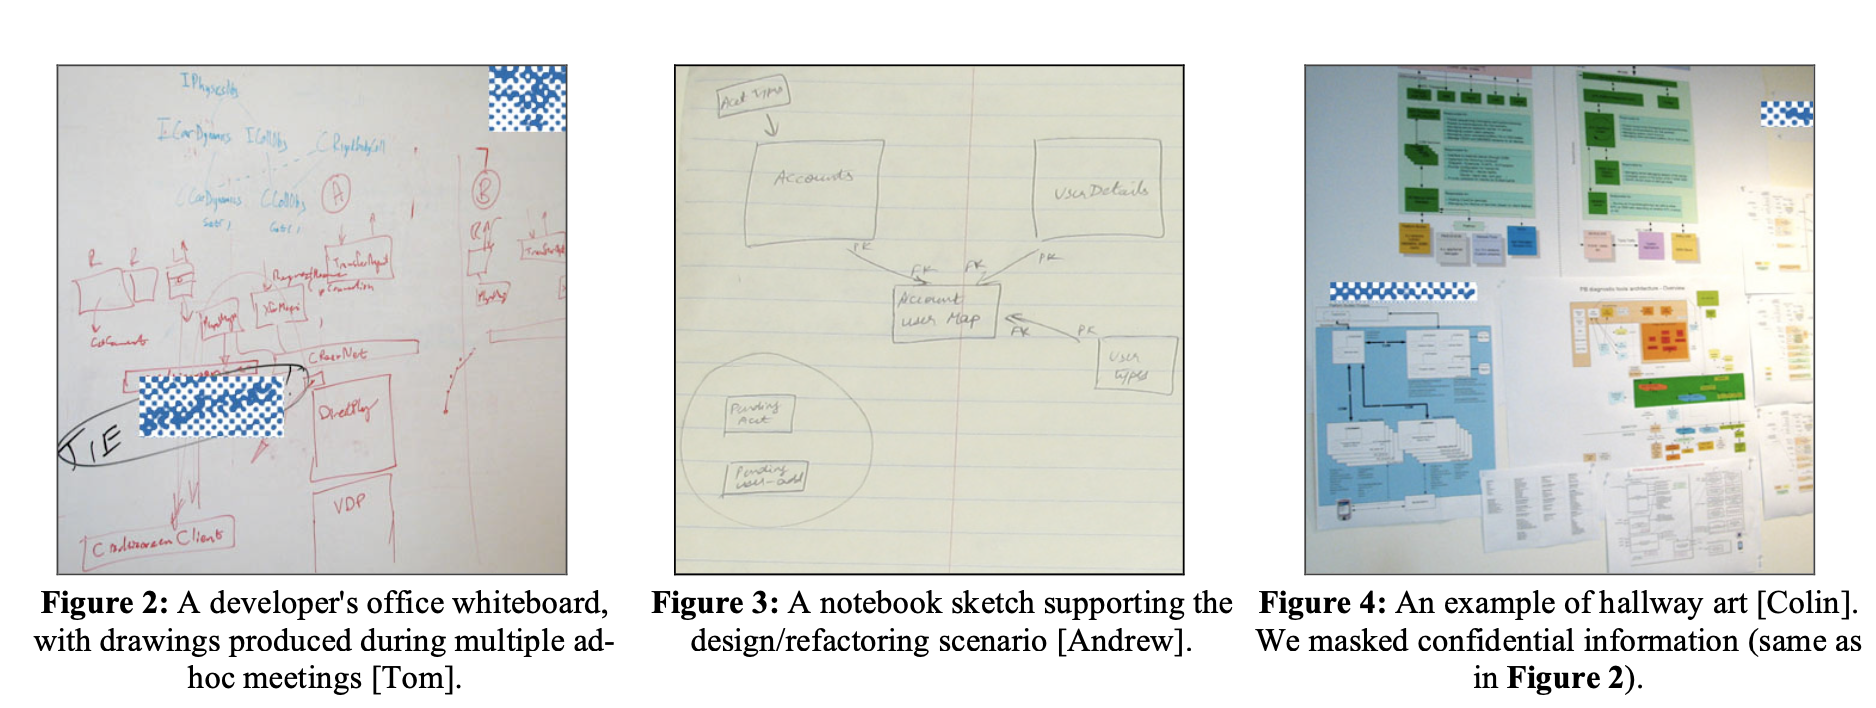
Flowcharts are useful to visualize and develop analytical workflow. It guides planning and anticipating the various computing and analytical tasks that will be required to complete an analysis. It also helps explaining the different steps to your collaborators and team. You can use a flowchart to spell out the logic behind a analytical workflow before ever starting to code. It can help to organize big-picture thinking and provide a guide when it comes time to code. More specifically, flowcharts can:
- Visualize the sequence of the different phases of the analytical process from data collection to implementing analyses
- Better define the scope and resources needed both in terms of project data management and computing resources needed
- Discuss who will be in charge and involved in the development of the different parts of the workflow
- List the products / outputs that will result from your analysis - such as data, codes, publications, web presence, … - and discuss how to best preserve and share them
There are conventions on how to use symbols to represent different parts of a workflow (see here for example). Although it is good to be aware of those conventions for sharing a workflow with your community, within a team the most important aspect is to be coherent and stick to this usage overtime.
The main benefit for the project is the process and discussion as a team to develop the workflow. It will ensure that everybody is on the same page and has the opportunity to provide inputs on the project. This workflow should be updated regularly as the project evolves.
Pseudocode
Often, programmers may write pseudocode as a next step, to provide greater detail than the flowchart in terms of processing steps and implementation. It will help you to define where iterations will be needed but also detect repeating blocks that might be well suited to be handled via the development of a function.
This technique aims at developing a sequence of pragrammatical steps in a manner that is easy to understand for anyone with basic programming knowledge. Pseudocode can be implemented more or less formally and at various levels of details. One additional advantage of going through this process is that it is agnostic of the tools / programming languages that you will be using to develop your analytical workflow.
In this course, we will be focusing on the process more than the exact syntax to use, keeping the level of details at a level that provide more details than a flow chart.
Further reading
- What is a flowchart: https://www.lucidchart.com/pages/what-is-a-flowchart-tutorial
- How to write pseudocode: https://www.wikihow.com/Write-Pseudocode
- An Introduction to Writing Good Pseudocode: https://towardsdatascience.com/pseudocode-101-an-introduction-to-writing-good-pseudocode-1331cb855be7
- How to write Pseudocode: A beginner’s guide https://blog.usejournal.com/how-to-write-pseudocode-a-beginners-guide-29956242698
