Documenting things
Only a few people with free time ahead of them will sit wondering about what to do next and think “what if I were to write some documentation!?”. Make it part of your workflow, and do not let it get out of sync too much as you iterate on your analysis.
Know your audience
There are actually various ways to document your work!! Here is a potential framework to help to think about those different types of documentation and their related audiences:
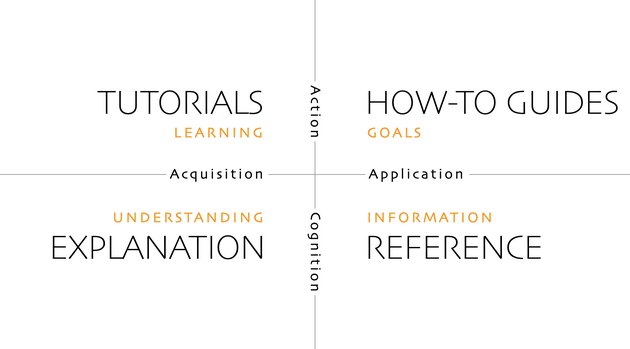
Your potential audience(s) for your documentation can be a future collaborator, an external researcher with no direct insight on your work, a potential user of a tool you developed?
Plan ahead
From the beginning of your project, you should plan the entire lifecycle of all your scientific products including data and code that will be used and generated. Several tools exist to this end, data management plans and software management plans are great ways to plan the steps of your projects and assign people’s responsibilities during and after the project ends.
The power of README
README files are not a new thing. They have been around computer projects since the early days. One great thing about the popularization of supporting the markdown syntax (and its web rendering in most code repositories) is that you can move beyond a simple text file and start to present a compelling entry point to your project that can link to various parts and external resources.
Good types of information to have on a README:
- Title capturing the essence of the project
- List of current contributors
- A short explanation of the goal / purpose
- How to install / where to start
- A quick demo on how to use the content (can be a link to another document as well)
- What to do if a bug is spotted
- How to contribute
- Licensing
- Acknowledgements of authors, contributors, sponsors or other related work
Adding images, short videos / animations can make a README more engaging.
Data README
Most data repositories will ask you to provide some kind of README file to help describe the content you are archiving. Here is a template you may customize for your project needs: https://doi.org/10.5281/zenodo.10828379
Code README
Need some inspiration ?
Here is a interesting template: https://github.com/navendu-pottekkat/awesome-readme/tree/master
When you start an R package with the
usethispackage, a README will be created for you with all the relevant sections for such type of project.pick a package you like and inspect their README
Making your code readable
It is important to make your code easy to read if you hope that others will reuse it. It starts with using a consistent style withing your scripts (at least within a project).
- Here is a good style guide for R: https://style.tidyverse.org/
- Style guide for Python: https://www.python.org/dev/peps/pep-0008/
import thisThe Zen of Python, by Tim Peters
Beautiful is better than ugly.
Explicit is better than implicit.
Simple is better than complex.
Complex is better than complicated.
Flat is better than nested.
Sparse is better than dense.
Readability counts.
Special cases aren't special enough to break the rules.
Although practicality beats purity.
Errors should never pass silently.
Unless explicitly silenced.
In the face of ambiguity, refuse the temptation to guess.
There should be one-- and preferably only one --obvious way to do it.
Although that way may not be obvious at first unless you're Dutch.
Now is better than never.
Although never is often better than *right* now.
If the implementation is hard to explain, it's a bad idea.
If the implementation is easy to explain, it may be a good idea.
Namespaces are one honking great idea -- let's do more of those!There is also the visual aspect of the code that should not be neglected. Like a prose, if you receive a long text without any paragraphs, you might be not very excited about reading it. Indentation, spaces, and empty lines should be leveraged to make a script visually inviting and easy to read. The good news is that most of the Integrated Development Environment (IDE) will help you to do so by auto formatting your scripts according to conventions. Note that also a lot of IDEs, such as RStudio, rely on some conventions to ease the navigation of scripts and notebooks. For example, try to add four - or # after a line starting with one or several # in an R Script!
Leveraging Notebooks
As we have discussed and experimented with Notebooks during the week. It is because Notebooks provide space to further develop content, such as methodology, around the code you are developing in your analysis. Notebooks also enable you to integrate the outputs of your scientific research with the code that was used to produce it. Finally, notebooks can be rendered into various format that let them share with a broad audience.
Notebooks are not only used within the scientific community, see here for some thoughts from Airbnb data science team.
Hands-on
Documenting
getPercent <- function( value, pct ) {
    result <- value * ( pct / 100 )
    return( result )
}
Try adding the Roxygen Skeleton to this function and fill all the information you think is necessary to document the function
Commenting
Let’s try to improve the readability and documentation of this repository: https://github.com/EDS-214/eds214-better-comments. Follow the instructions on the README
For inspiration, you can check out the NASA code for APOLLO 11 dating from 1969: https://github.com/chrislgarry/Apollo-11!!
Computing Environment
Your analysis was done with specific versions of the program used (e.g. R 4.4.3) but also of all the packages involved, as well as the specifications of the Operating System (OS) that was used. The good use is that there are tools to let you systematically capture this information.
In R:
sessionInfo() or devtools::session_info() are great ways to capture all this information. You should save it into a session_info.txt file to include in your GitHub repository
Virtual environments
You can even go a step further and help others to recreate the same computing environment that you used independently of what versions you have installed on your machine: https://rstudio.github.io/renv/articles/renv.html
Metadata
This a very important topic for scientific reproducibility and for today we will be only provide a partial overview of this broader topic.
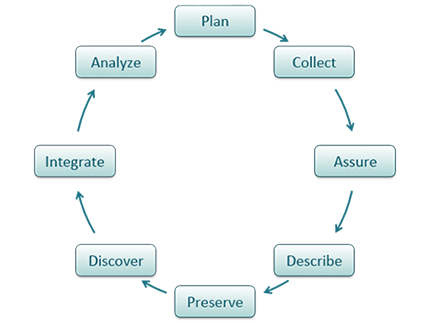
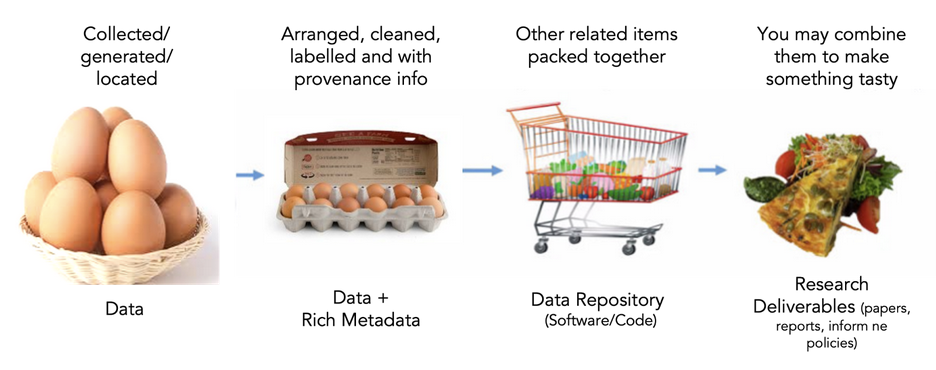
Metadata (data about data) is an important part of the data life cycle because it enables data reuse long after the original collection. The goal is to have enough information for the researcher to understand the data, interpret the data, and then re-use the data in another study.
Here are good questions to answer with your metadata:
- What was measured?
- Who measured it?
- When was it measured?
- Where was it measured?
- How was it measured?
- How is the data structured?
- Why was the data collected?
- Who should get credit for this data (researcher AND funding agency)?
- How can this data be reused (licensing)?
Metadata standards
How do you organize all this information? You could use a free-form format, like a README file or spreadsheet. But there is also a great advantage to using a more standardized way that will make the content not only Human readable but also machine-readable. This will enhance the data discovery as specific information will be potentially tagged or attributed to specific aspects of your data (e.g. spatial or temporal coverage, taxonomy, …).
There are a number of environmental metadata standards (think, templates) that you could use, including the Ecological Metadata Language (EML), Geospatial Metadata Standards like ISO 19115 and ISO 19139, the Biological Data Profile (BDP), Dublin Core, Darwin Core, PREMIS, the Metadata Encoding and Transmission Standard (METS), and the list goes on and on.
Some repositories will have standards baked into their systems, so if you plan to archive and preserve your data in a disciplinary repository with specific metadata requirements it is always important to check what are these in advance. You may need to rework your existing documentation accordingly.
Data provenance & semantics
Data provenance refers to one’s ability to trace the original source of a data set to the raw data that were used as input for the processing/analysis that led to the creation of this data set. It can be done more or less formally and this is an active area of research. Today, we will be focusing on capturing the information about the data you are collecting. Here are a set of good questions to help you in that process:
- Source / owner (Person, institution, website, ….)
- When was it acquired ?
- By whom on the WG ?
- Where is it currently located (Google drive, server, ….) ?
- Short description of the data
- Track if it is used in your analysis
Here is a template of a data log that could hep to store this information
Another important and related aspect and also active field of research is data semantics. Often data sets store complex information and concepts that can be described more or less accurately. Let’s take an example, you have received a csv file storing a table with several variables about a fish stock assessment. One of the variables is named “length”. However, there are many ways to measure the length of a fish. Which one is it?
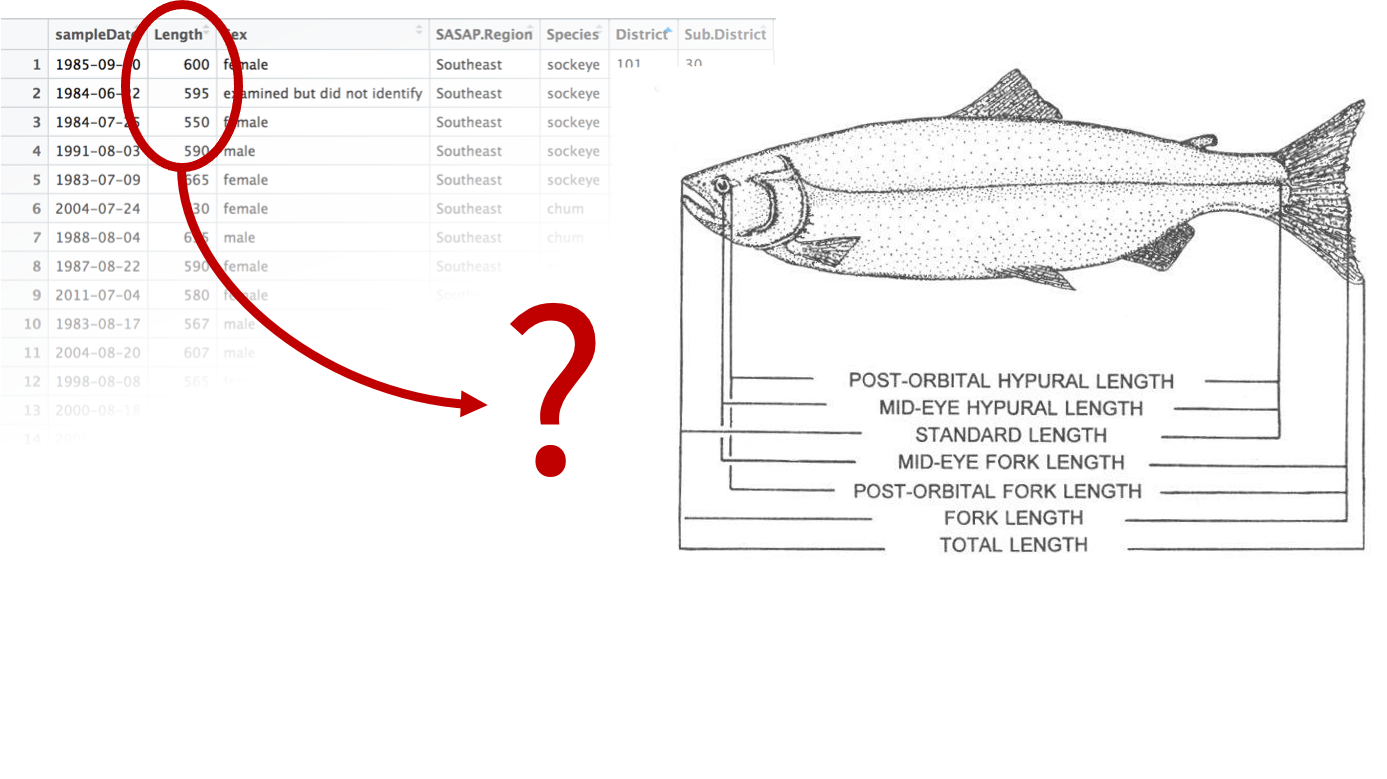
Data semantics aims at clearly identify those concepts relying on vocabularies and ontologies, such as ENVO in environmental sciences. In addition, it enables the leverage relations between those concepts to help with (data) discovery.
Yourself
You as an Author!!
It is important to be able to reference yourself as a researcher and as an author of your work in a non ambiguous manner. ORCID is a great way to create a persistent digital identifier (an ORCID iD) that you own and control, and that distinguishes you from every other researcher. ORCID is also more and more used as an authentication system for many services (e.g. data repositories).
Licensing
It is a good practice to add a license to a repository / project. It will help to clarify what are the expectations regarding using and potentially contributing to this work.
Here is a good website to choose a license:
Here is also good set of instructions on how to make this happen on a GitHub repository: https://docs.github.com/en/github/creating-cloning-and-archiving-repositories/creating-a-repository-on-github/licensing-a-repository
Note that for content (such as this course), there is also another type of licensing that can be used: https://creativecommons.org/licenses/
Further Reading
- Awesome README: https://towardsdatascience.com/how-to-write-an-awesome-readme-68bf4be91f8b
- How to write a great README: https://x-team.com/blog/how-to-write-a-great-readme/
- Python Hichhiker’s guide:
- Documenting Python Code: A Complete Guide: https://realpython.com/documenting-python-code/
- Roxygen2: https://cran.r-project.org/web/packages/roxygen2/vignettes/roxygen2.html
- Introduction to Software Engineering by Jason Coposky: https://github.com/NCEAS/training/blob/master/2014-oss/day-09/IntroductionToSoftwareClass.pdf
- Functional programming in R: http://adv-r.had.co.nz/Functional-programming.html#functional-programming
- Scoping in R: http://adv-r.had.co.nz/Functions.html
- https://www.quora.com/What-is-the-difference-between-programming-languages-markup-languages-and-scripting-languages
- http://stackoverflow.com/questions/17253545/scripting-language-vs-programming-language
- Software carpentry: https://swcarpentry.github.io/r-novice-inflammation/06-best-practices-R/
Acknowledgements
Large portion of this material have been adapted from NCEAS Reproducible Research Techniques for Synthesis course https://learning.nceas.ucsb.edu/2021-02-RRCourse/
Comments
Real Programmers don’t comment their code. If it was hard to write, it should be hard to understand.
Tom Van Vleck, based on people he knew…_ (https://multicians.org/thvv/realprogs.html)
Joke aside, it is really hard to comment too much your code, because even steps that might seem trivial today might not be so anymore in a few weeks or months for now. In addition, a well commented code is more likely to be read by others. Note also that comments should work in complement of the code and should not being seen as work around vague naming conventions of variables or functions.
Header
It is good to add a header to your script that will provide basic information such as:
Optional:
Note that R Studio does something similar by default when creating an new R Markdown document!
Inline
It does not matter if you are using a script or notebook. It is important to provide comments along your code to complement it by:
Other thoughts:
Functions
Both Python and R have conventions on how to document functions. Adopting those conventions will help you to make your code readable but also to automate part of the documentation development.
Roxygen2
The goal of roxygen2 is to make documenting your code as easy as possible. It can dynamically inspect the objects that it’s documenting, so it can automatically add data that you’d otherwise have to write by hand.
How do we insert it? Make sure you cursor is inside the function you want to document and from RStudio Menu Code -> Insert Roxygen Skeleton
Example:
Try it! - Copy the function (without the documentation) in a new script - Add a third parameter to the function such as it sums 3 numbers - Add the Roxygen skeleton - Fill it to best describe your function
Note that when you are developing an R package, the Roxygen skeleton can be leveraged to develop the help pages of your package so you only have one place to update and the help will synchronize automatically.
Python Docstring
A docstring is a string literal that occurs as the first statement in a module, function, class, or method definition. Such a docstring becomes the
__doc__special attribute of that object.Here for more: https://www.python.org/dev/peps/pep-0257/